

Team Analytics aggregate usage across both Orbital IDE and OrbCode CLI
under a single MatterAI workspace.
Team Usage Insights
The Team Usage Insights section answers the top-line question every engineering leader asks: how much of the code we are shipping is being written by the agents?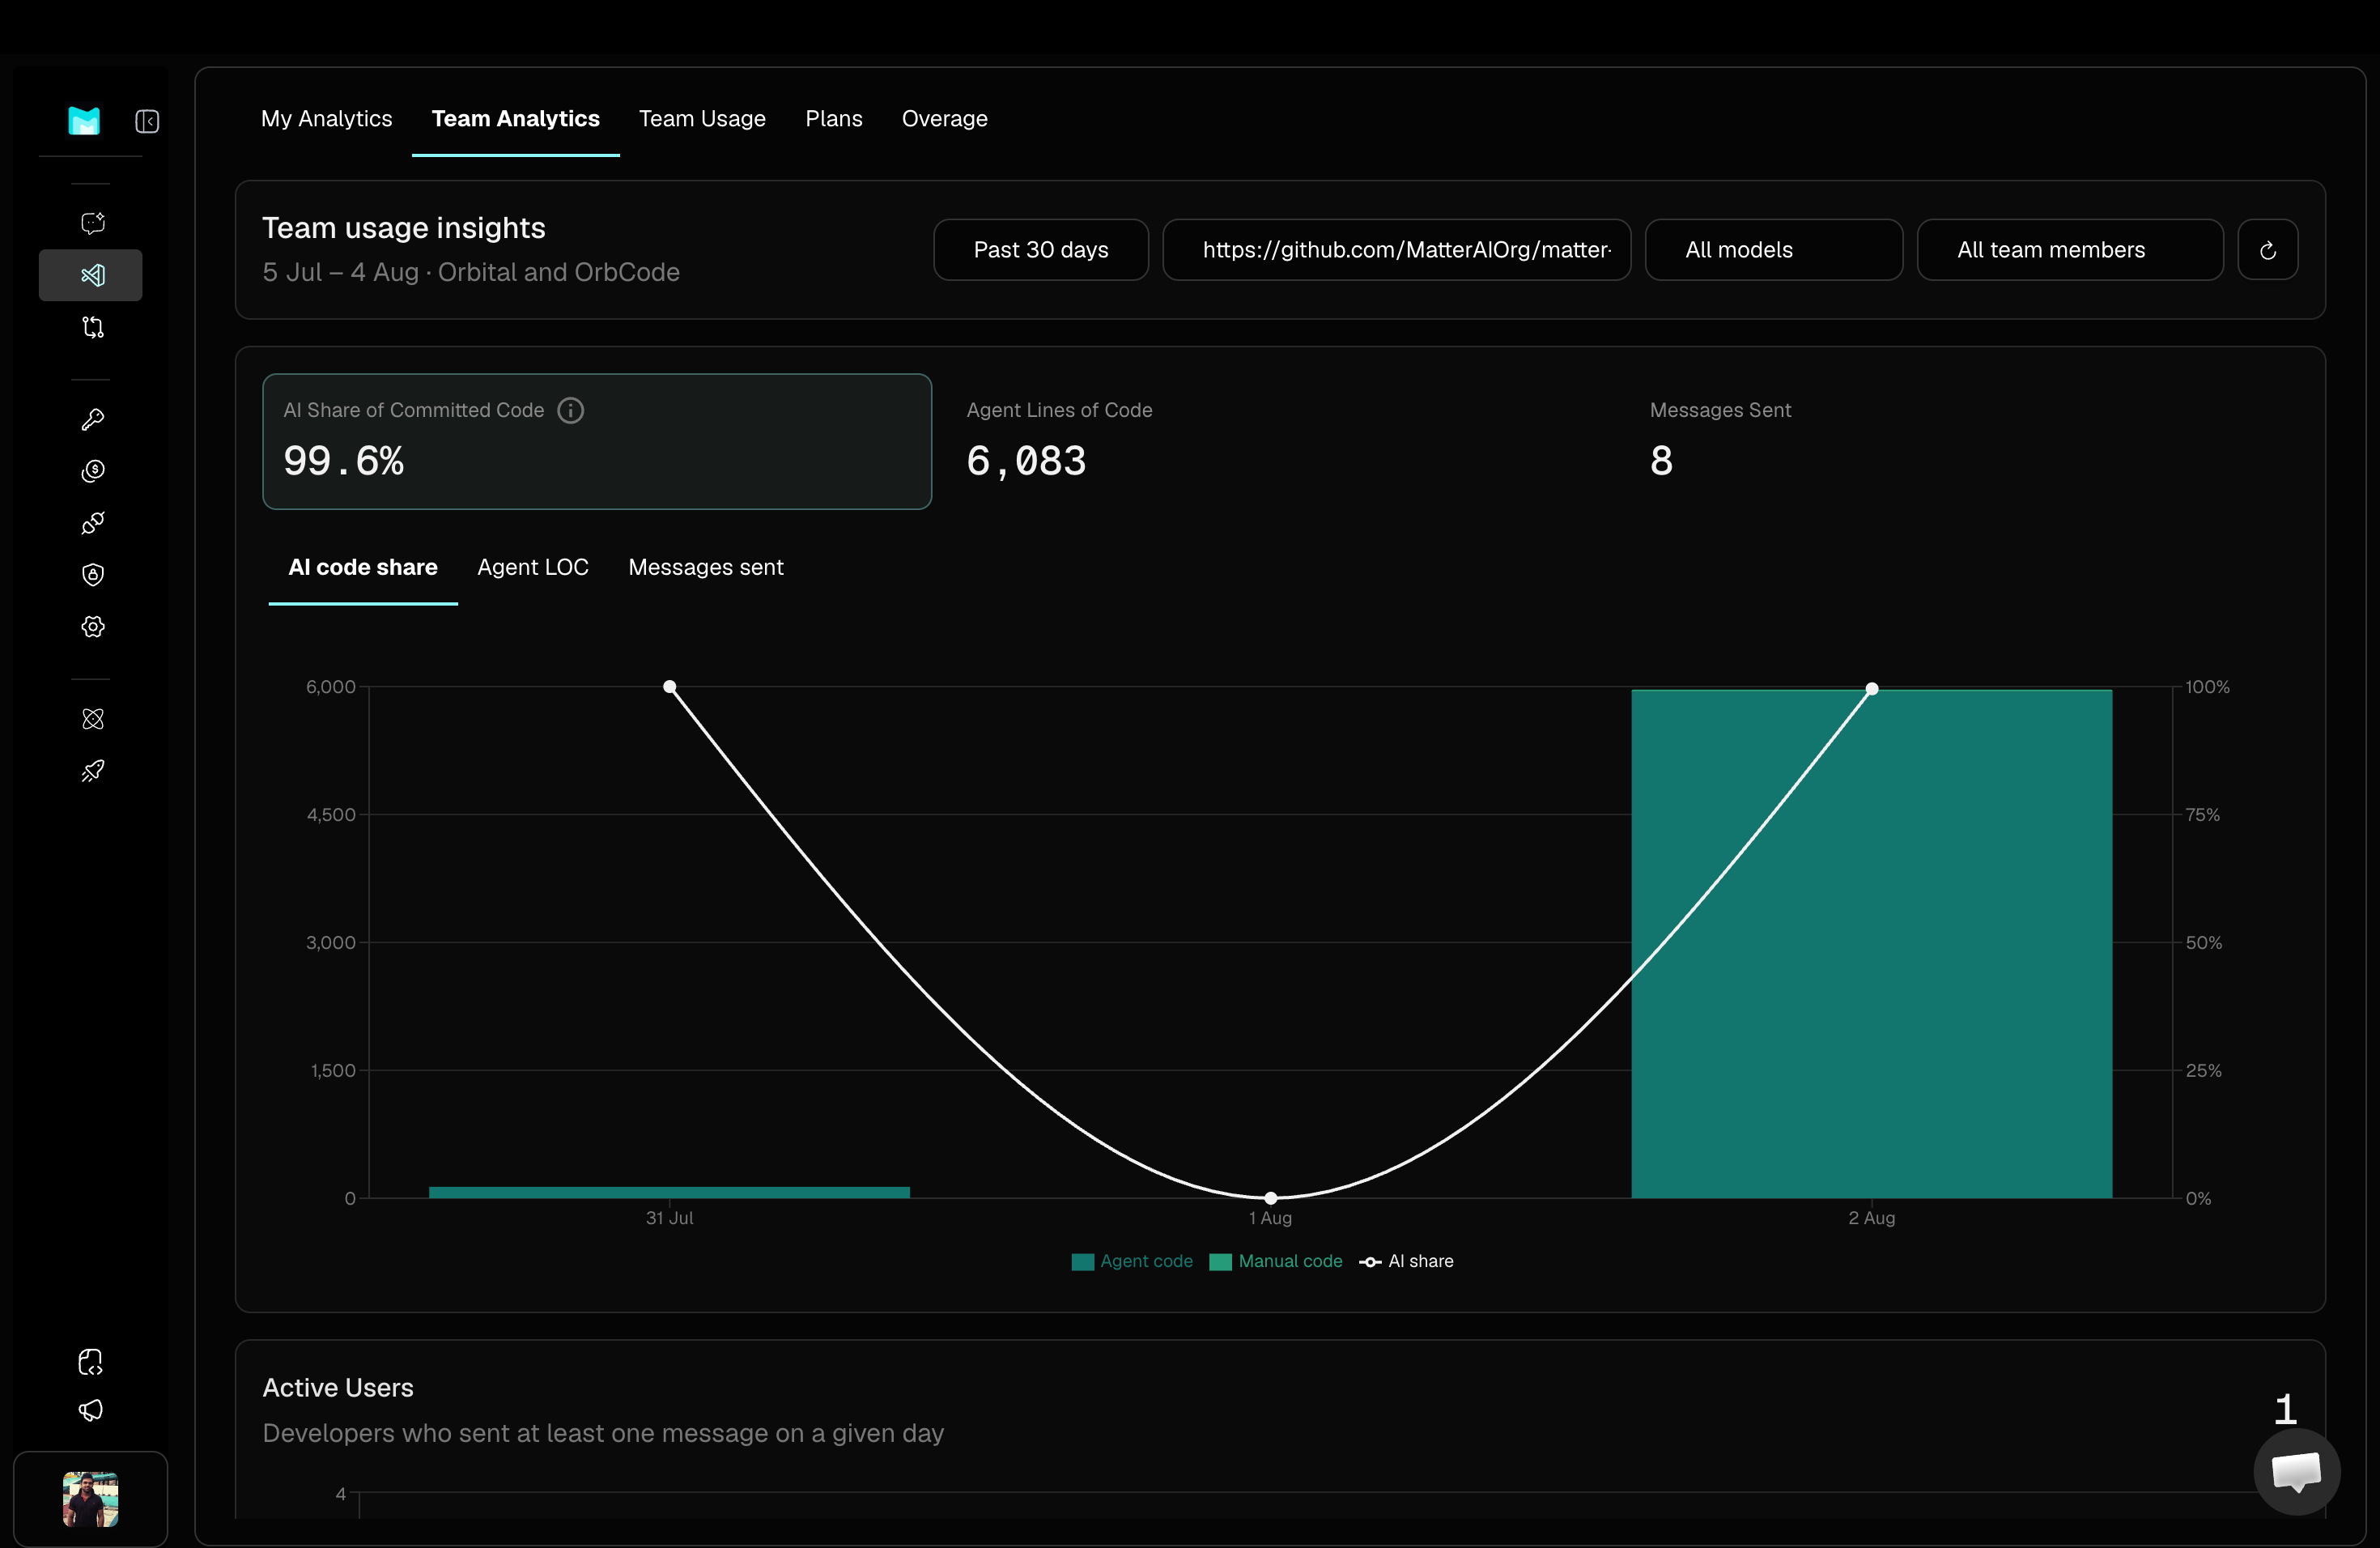
Top-line Metrics
- AI Share of Committed Code — Percentage of lines in recent commits that were authored by Orbital or OrbCode. A high share means the agents are doing real work, not just suggesting snippets that get rewritten.
- Agent Lines of Code — Total lines added by the agents across the selected period and repositories.
- Messages Sent — Total developer messages sent to the agents. A useful proxy for engagement alongside the LOC number.
Chart
The chart below the metric cards is a dual-axis view that pairs agent-authored code (bars) with AI share (line) over time, so you can see whether volume and share are moving together or diverging.- Sub-tabs — switch the chart between AI code share, Agent LOC, and Messages sent without changing the filters.
- Legend —
Agent code(bars),Manual code(bars),AI share(line, right axis). - X-axis — daily buckets across the selected date range.
Filters
The Team Usage Insights view is driven by a filter bar at the top:- Time period —
Past 30 daysand other presets. - Repository — pick a single repo (e.g.
https://github.com/MatterAIOrg/matter…) or all repos. - Model —
All modelsor a specific Axon model. - Team member —
All team membersor a specific developer. - Reset — clear all filters back to the workspace default.
5 Jul – 4 Aug · Orbital and OrbCode.
Active Users
The Active Users section tracks developer engagement with Orbital and OrbCode over time and surfaces the heaviest users in a leaderboard.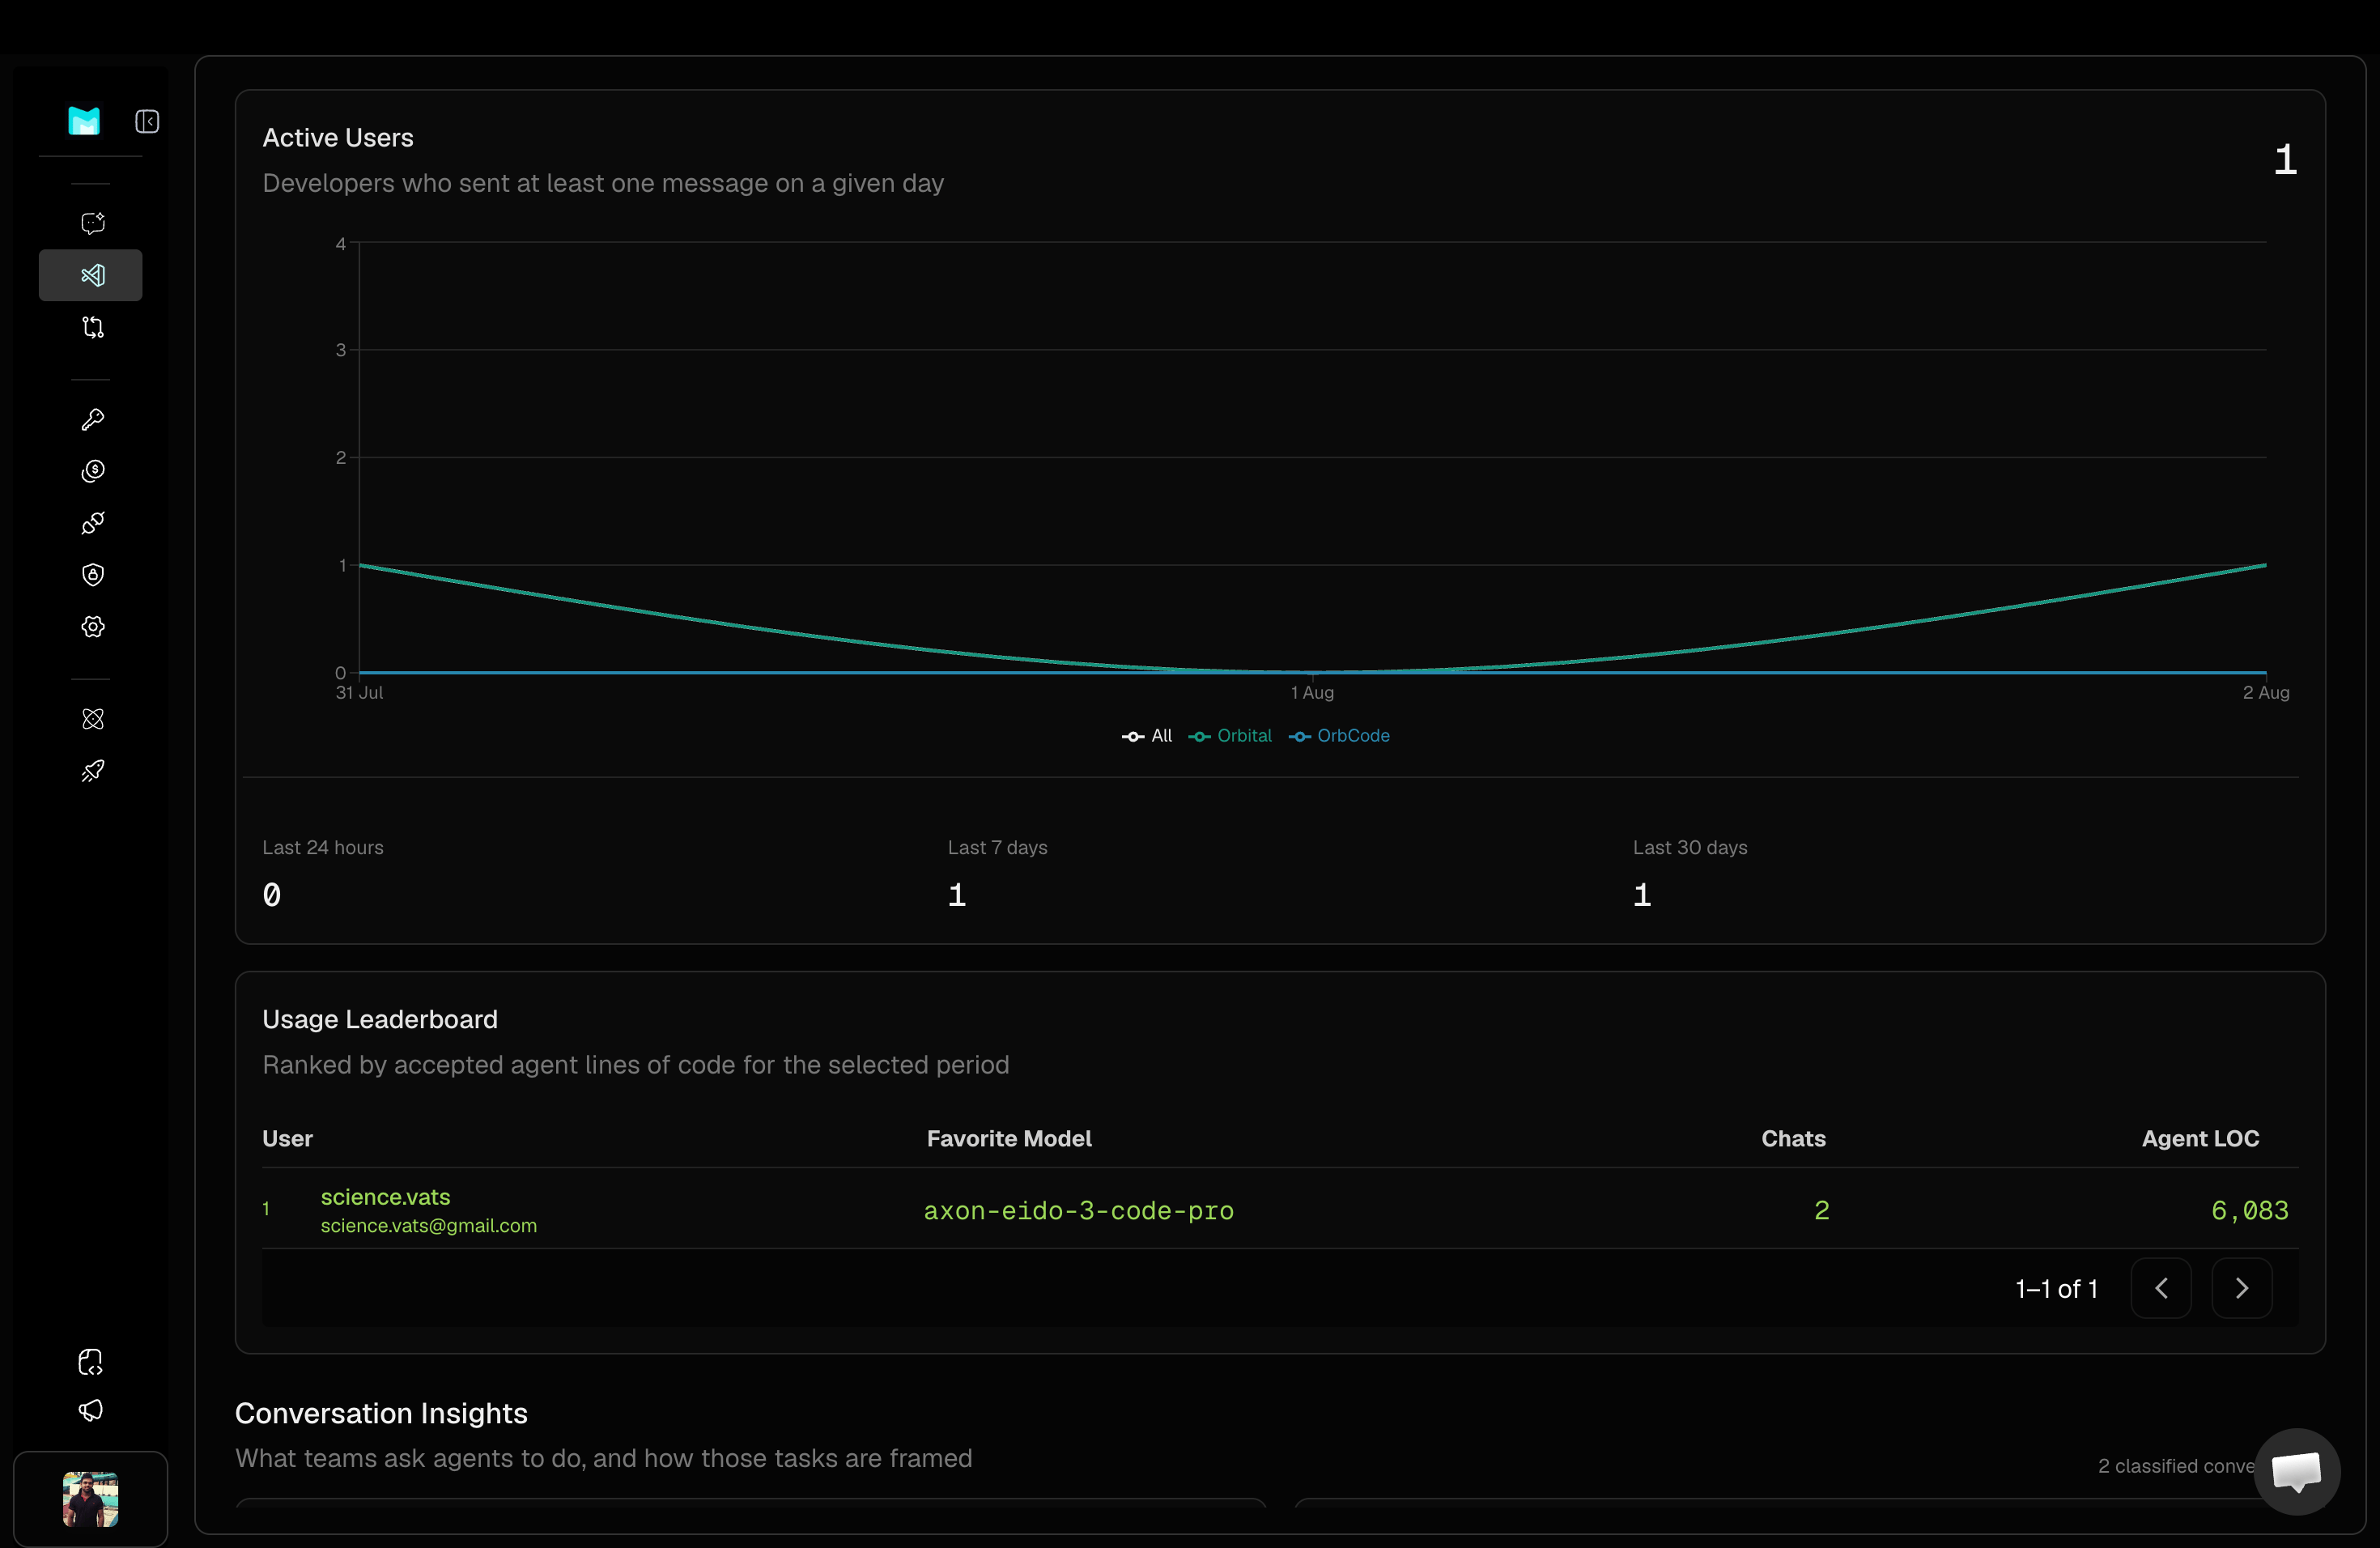
Active Users Chart
A daily line chart of developers who sent at least one message on a given day, broken down by product:- All — combined Orbital + OrbCode activity.
- Orbital — IDE sessions only.
- OrbCode — CLI sessions only.
- Last 24 hours — developers active in the last day.
- Last 7 days — developers active in the last week.
- Last 30 days — developers active in the last month.
Usage Leaderboard
Ranked by accepted agent lines of code for the selected period. Each row shows:- User — name and email of the developer.
- Favorite Model — the Axon model they use most (e.g.
axon-eido-3-code-pro). - Chats — number of distinct chat sessions in the period.
- Agent LOC — accepted lines of code contributed by the agents for that user.
Conversation Insights
Conversation Insights classifies what developers actually ask the agents to do, so you can see whether the team is using Orbital and OrbCode for new feature work, maintenance, debugging, or learning.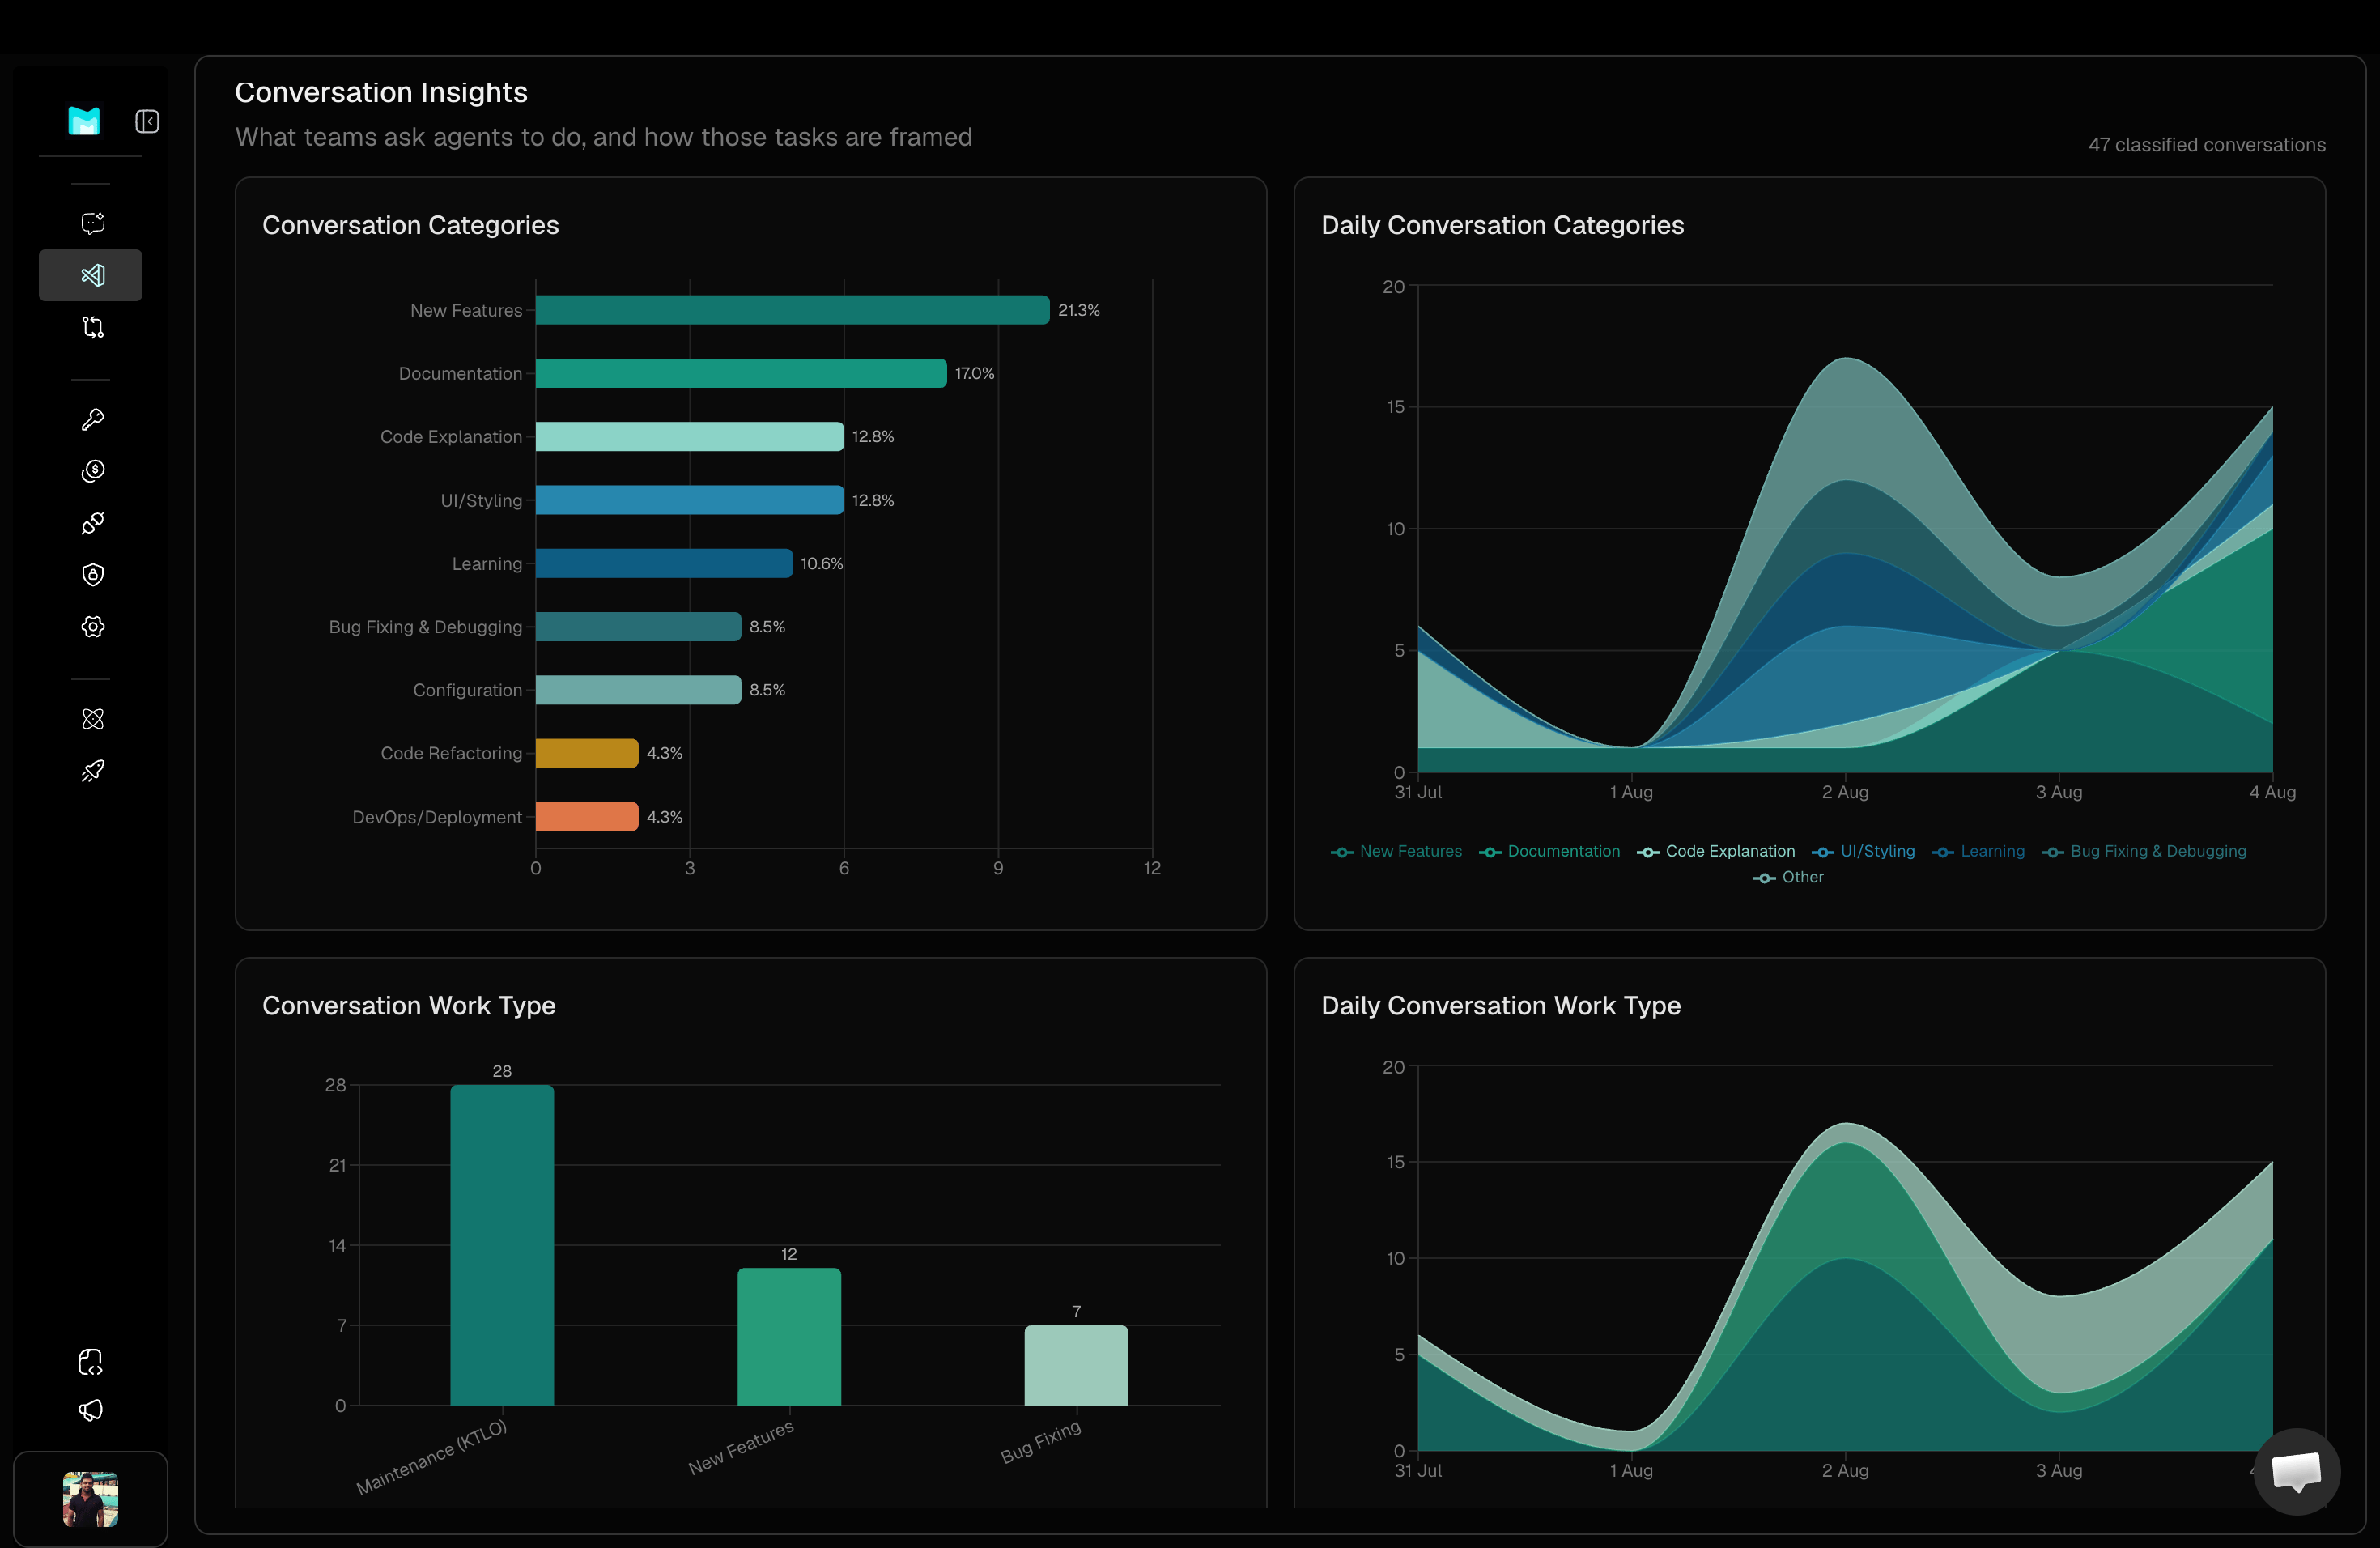
47 classified conversations) and the framing: what teams ask agents to do, and how those tasks are framed.
Conversation Categories
A horizontal bar chart of every classified conversation, grouped by category. Each bar shows the share of total conversations:- New Features — building new functionality.
- Documentation — writing or updating docs.
- Code Explanation — asking the agent to explain existing code.
- UI/Styling — front-end and styling changes.
- Learning — exploratory questions and tutorials.
- Bug Fixing & Debugging — diagnosing and fixing defects.
- Configuration — config, env, and tooling changes.
- Code Refactoring — restructuring without changing behavior.
- DevOps/Deployment — CI/CD, infra, and deploy tasks.
Daily Conversation Categories
A stacked area chart of the same categories over time (e.g.31 Jul – 4 Aug), so you can see whether the mix of work is shifting week to week.
Conversation Work Type
A vertical bar chart that buckets every conversation into one of three high-level work types:- Maintenance (KTLO) — keeping the lights on: fixes, small tweaks, dependency updates.
- New Features — net-new product work.
- Bug Fixing — defect investigation and resolution.
Daily Conversation Work Type
The same three work types as a stacked area chart over time, so you can spot whether a sprint is drifting toward maintenance or new builds.Prompt Quality
Prompt Quality surfaces how well the team is framing requests to the agents. Better-framed prompts produce better agent output, so this section is a leading indicator of output quality.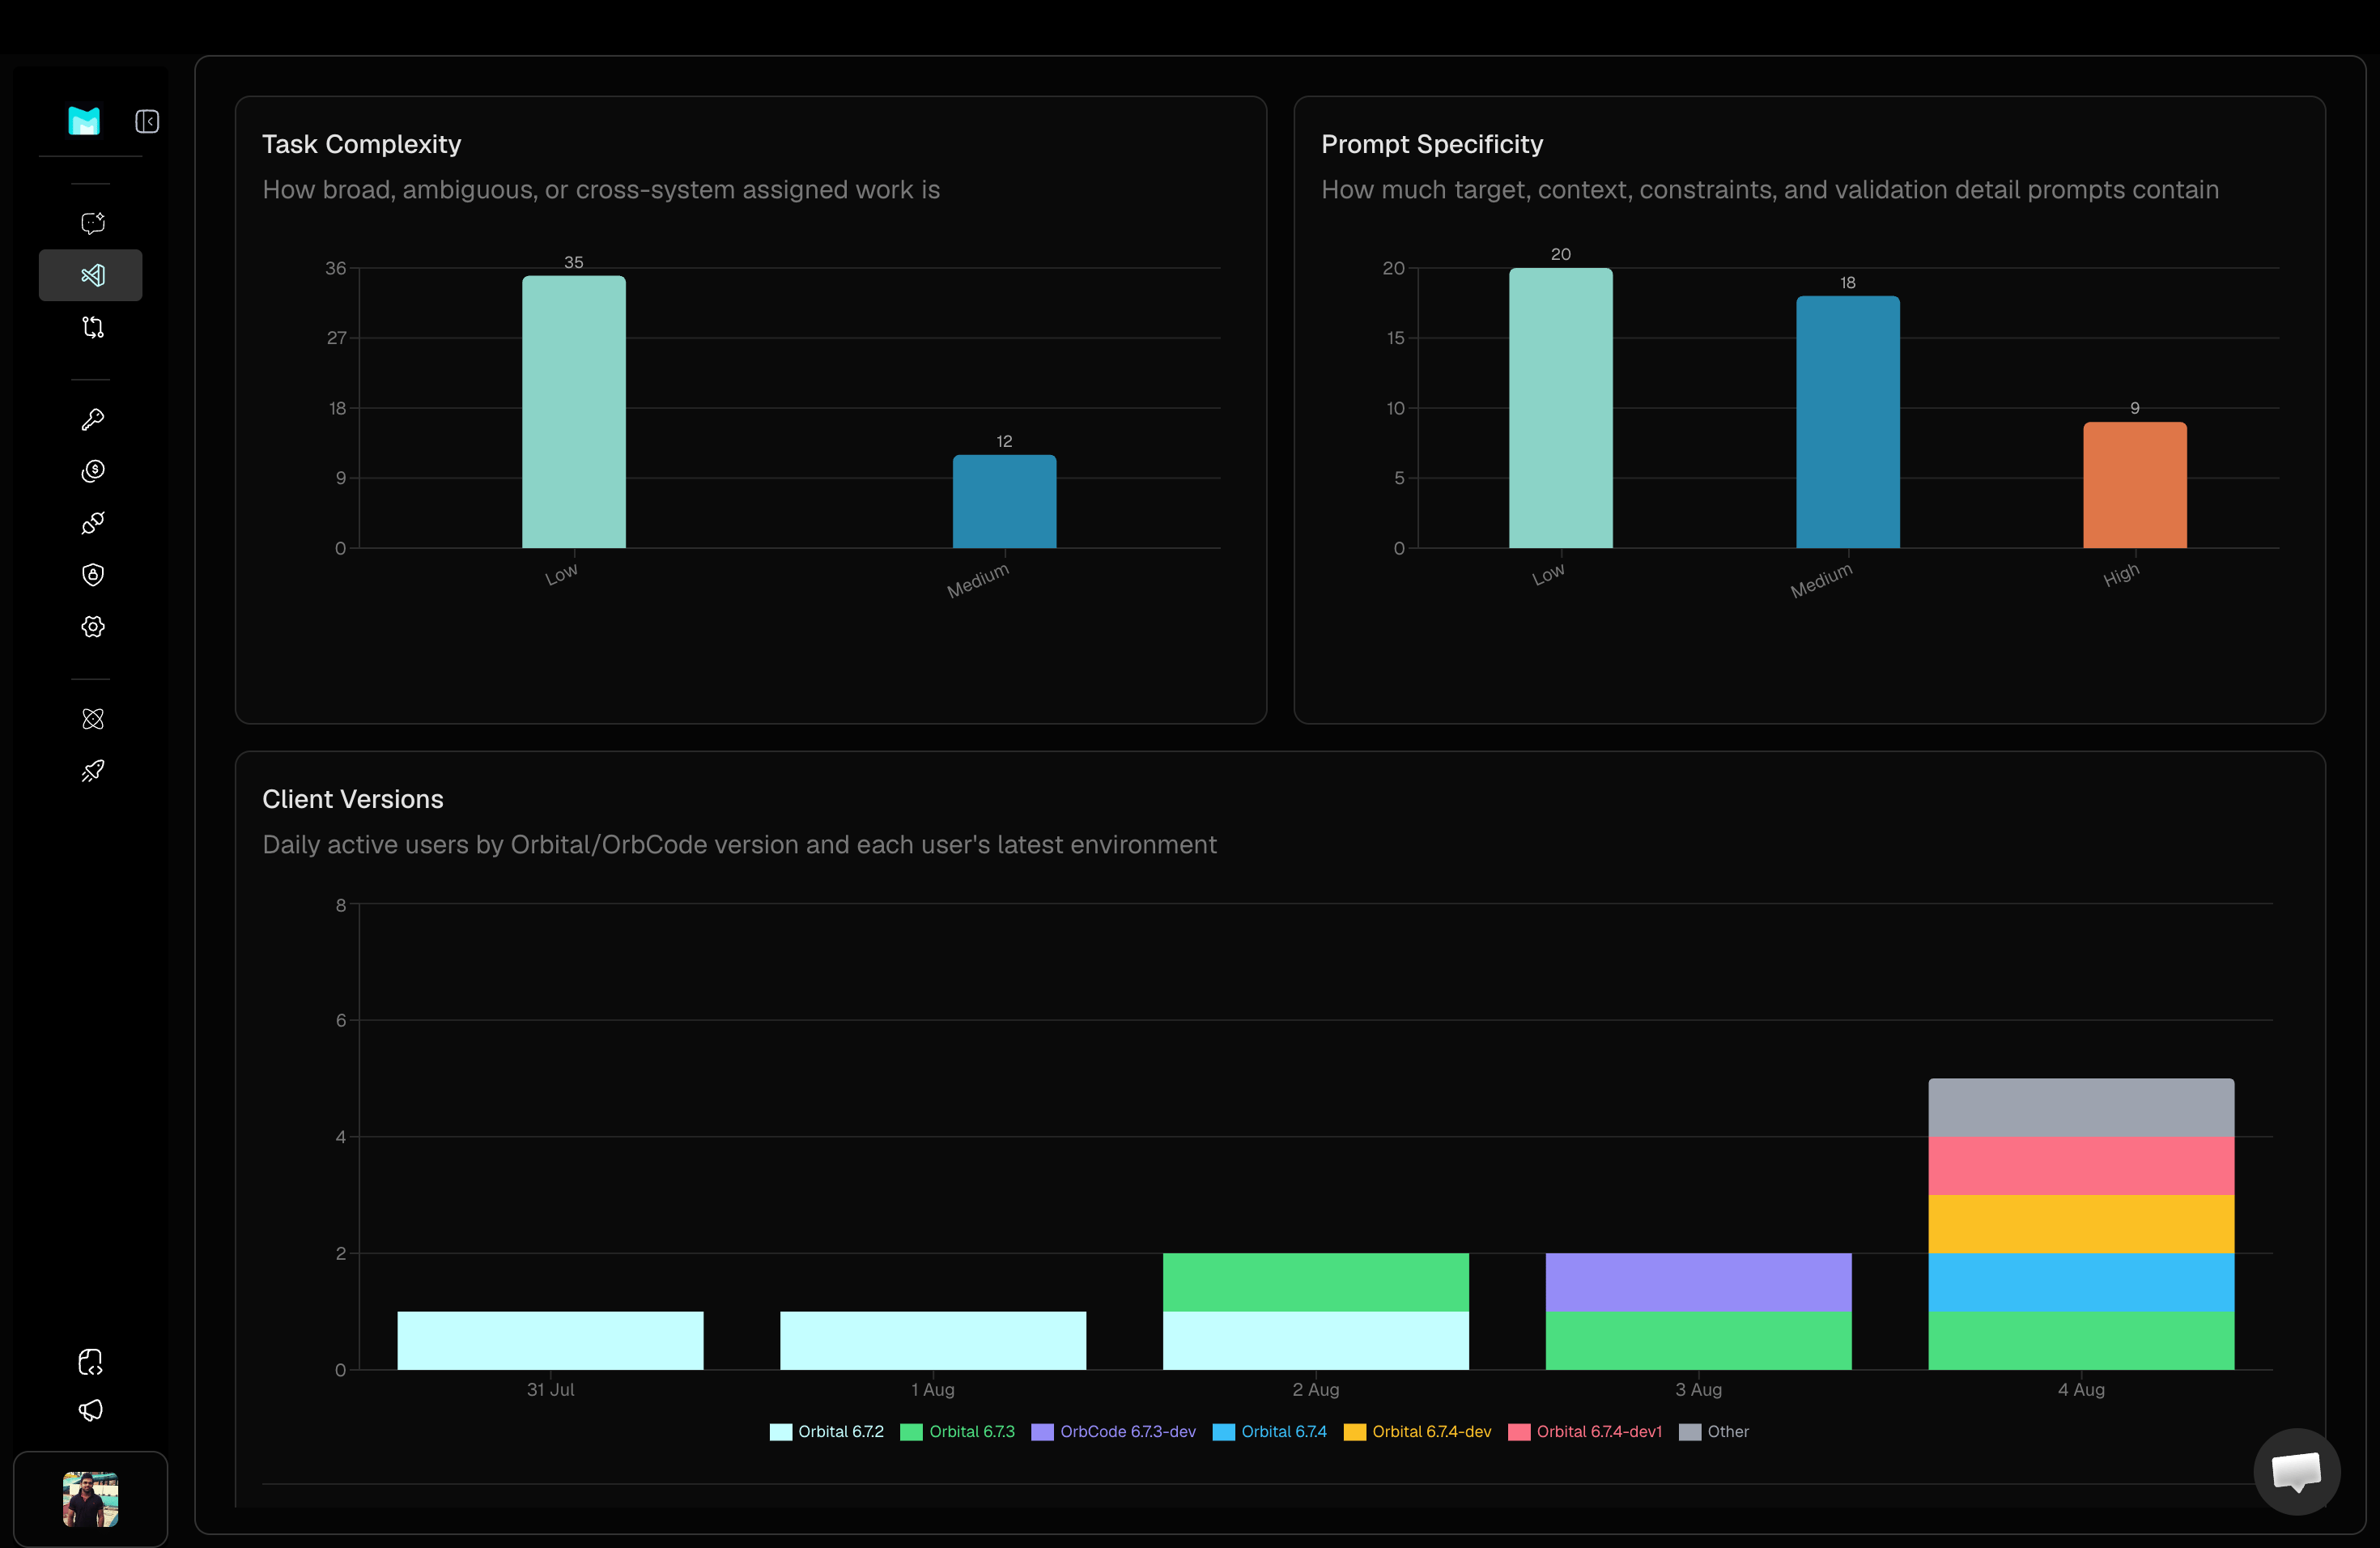
Task Complexity
How broad, ambiguous, or cross-system the assigned work is. A vertical bar chart bucketed into:- Low — small, well-scoped tasks.
- Medium — moderate scope, may touch a few files or systems.
Low complexity is a good sign that the team is decomposing work into agent-sized chunks.
Prompt Specificity
How much target, context, constraints, and validation detail the prompts contain. A vertical bar chart bucketed into:- Low — vague or under-specified prompts.
- Medium — adequate context but missing constraints or acceptance criteria.
- High — well-specified prompts with clear targets and validation.
High specificity over time correlates with higher acceptance rates and fewer re-prompts.
Client Versions
Daily active users broken down by Orbital/OrbCode version, so you can see exactly which client builds are in use and when to deprecate old ones. The stacked bar chart covers the selected date range (e.g.31 Jul – 4 Aug) and the legend lists every version seen in the period, e.g.:
Orbital 6.7.2Orbital 6.7.3OrbCode 6.7.3-devOrbital 6.7.4Orbital 6.7.4-devOrbital 6.7.4-dev1Other
Other bucket captures long-tail versions and unparseable client strings so the named versions stay readable.
Filtering and Customization
Every section in Team Analytics respects the same filter dimensions, so you can drill from a company-wide view down to a single developer in a single repo.- Time Period —
Past 7 days,Past 30 days,Past 90 days, quarter, or a custom range. - Product — Orbital IDE only, OrbCode CLI only, or both combined.
- Repository — one repo, a subset, or all repositories in the workspace.
- Model — filter by Axon model family or by external provider.
- Team member — individual user, a team, or the entire organization.
Filters compose across sections. For example, you can view Conversation
Insights for
axon-eido-3-code-pro on the backend repo for the platform
team over the last 30 days.Privacy and Data Scope
Team Analytics only surface data from developers who have signed in to Orbital or OrbCode with a MatterAI account belonging to your workspace. Local-only sessions that never reach the MatterAI backend are not included.- No code content is stored — Analytics track counts, tokens, and metadata. The actual code edited by the agents is never persisted for analytics purposes.
- Per-workspace isolation — Data from one MatterAI workspace is never visible to another.
- Exportable — All dashboards support CSV export for offline analysis or integration with BI tools.
Getting Started with Team Analytics
To access Team Analytics for Orbital and OrbCode:- Sign in to the MatterAI dashboard with a workspace admin or owner account.
- Navigate to Team Analytics in the top tab bar.
- Use the filter bar to set the time period, repository, model, and team member scope.
- Switch between the Team Usage Insights, Active Users, Conversation Insights, and Prompt Quality sections.
- Export any chart to CSV for reporting or further analysis.
Team Analytics data is updated in near real-time. New sessions, edits, and
model calls typically appear in the dashboard within a few minutes.